One of the major challenges in the lending business is understanding your investment portfolio and performance over time. Most banks and lending businesses use complicated software and special tools to calculate profits and measure their performance. With Lenme, we had a unique challenge to solve. How do we give you tools to have visibility on your portfolio, profits/loss, and performance; all on a small mobile screen? Our team rose to the challenge, we came up with a newly designed graph that helps us provide you with these tools.
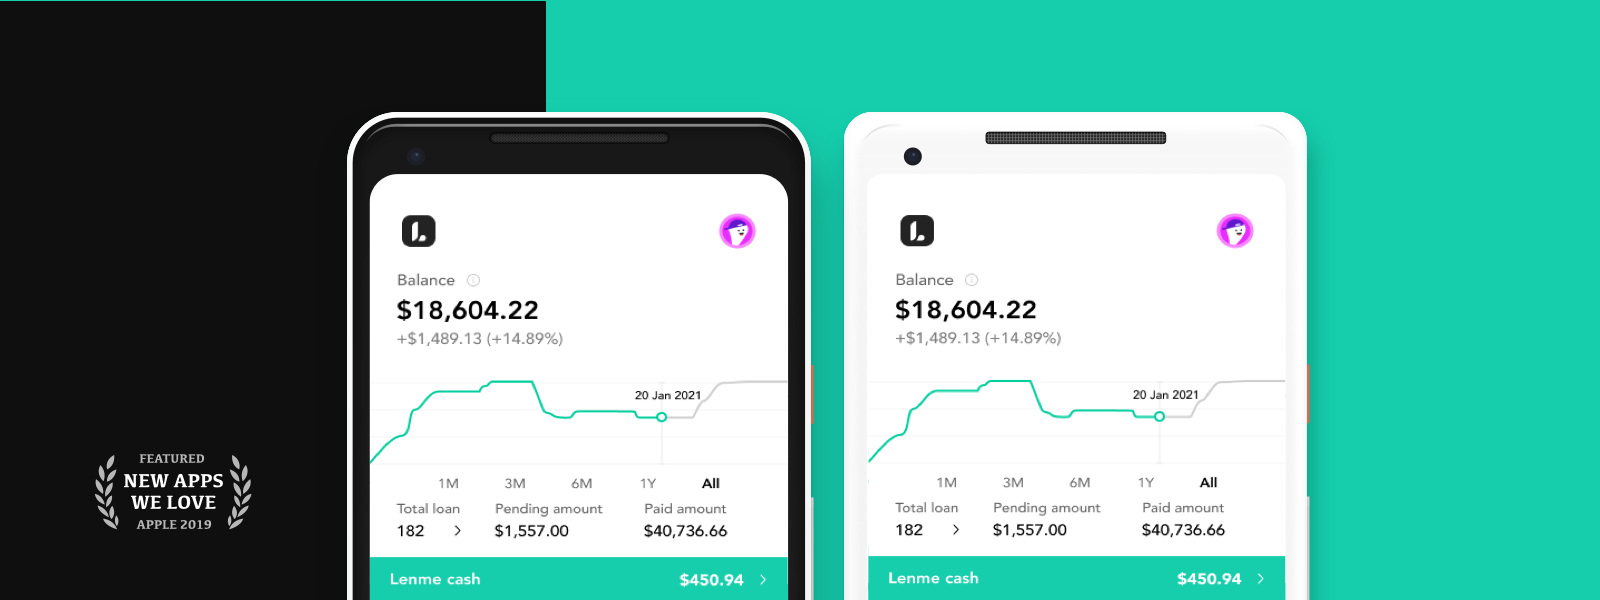
Today we announce the launch of a newly designed graph for our app investors and lenders. Not only is the new graph designed to give you the full picture of your investment portfolio, but it also shows your performance over time.
The first major change we made is the ability to easily navigate through the graph and understand your performance. Now the graph will show you a detailed analysis for different time frames. Here are the time frames:
- If “All ” is selected: the transactions since you started investing in Lenme regardless of a specific time frame.
- If “1Y” is selected: Performance during the last year
- If “6M” is selected: Performance during the last 6 months
- If “3M” is selected, performance during the last 3 months
- If “1M” is selected, performance during the last 1 month
However, during any selected period, you can still know your performance by navigating to that date.
What you need to know
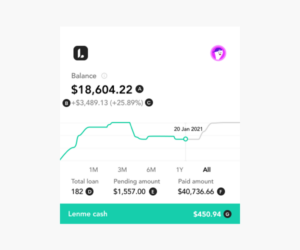
Lenme’s new graph highlights new variables that are important to consider when evaluating your investment portfolio. Here are the details of each variable.
Balance (A): The Balance represents your investment portfolio value, which equals the sum of outstanding loans and cash available in our platform.
Profit/Loss (B): The profit/loss variable represents your net gain or loss based on your investment in the selected period. The gain/loss accounts for all returns made from your loans and all fees subtracting losses due to missed payments. This number increases when you collect payments and fees and decreases when your borrower misses a payment. Positive =profits and negative =losses.
Profit/Loss Percentage (C): Profit/Loss percentage refers to the profit or loss one made represented in a percentage from the initial investment.
Total Loans (D): This is the total number of loans in the selected period.
Pending Amount (E): This is the sum of all your pending payments expected to be paid by the borrowers. This number helps you understand your portfolio value and how much you expect to be paid.
Paid Amount (F): Is the sum of all paid payments by the borrowers in the selected period. This number gives you an idea of how much you received in total from all the loans you have.
Lenme Cash (G): Lenme Cash represents your current cash balance. You can withdraw this cash anytime with no fees or invest it in more loans to make more profit.
To improve our service and provide investors with the best experience, we would love to hear your feedback. You can fill out our survey here.